

As we saw in Part II of this three part series, there is something wrong with Figure 4 in Plioplys et al. 1998.1 As a matter of fact, there is something wrong with all of the figures in the study, though it is a bit more difficult in some cases to confirm this. If the reader should like to work out the details for another, Figure 2 is a fairly easy place to start. In Figure 4, as we have seen, data that should apparently run out by age 11 years continues all the way to age 34 years. Did the authors create these curves out of whole cloth?
We do not believe so. Our personal view is that this began as an honest mistake, and one that has been made by a surprising number of authors in works published in a number of reputable journals. But let us make no mistake: what the authors did is wrong, and the reported results do not reflect the reality of the data with which they had to work. It introduces a bias in the analysis of survival that has become known as the immortal time bias.2 We will expand on this concept in a future blog (now posted) and provide a number of other examples where this particular error has made its way into print.
Referring again to Figure 4 from Plioplys et al. 19981 (illustrated below), let us recall that as it stands, there must have been information on 11 children involved in the calculation of the drop from 100% at age 4 to 91% at age 5, representing 1 death out of 11 living prior to age 5 for a survival probability of 10 ÷ 11 = 91%. Given that the study only spanned a period from 1986 to 1996, the survival curve couldn’t possibly go to age 34 given that all children involved were under age 5 (and were under age 1 according to the study) at the start. So what is actually going on here?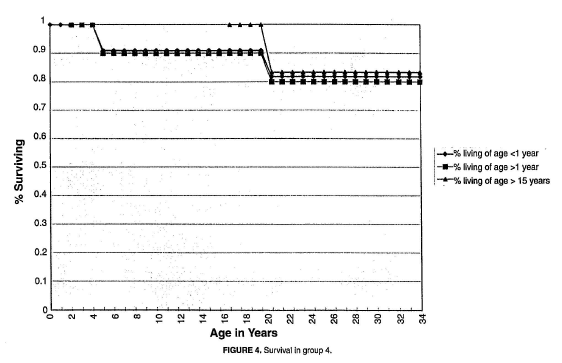
The most likely explanation is that not all 11 children in group 4 were under age 1 during the study. One piece of evidence for this is that the curve for those “living of age > 15 years” exists. Anyone over 15 years of age during a ten year study could not have also been under a year of age during the same study. In fact, given that the curve for the “living of age > 15” drops from 100% to about 83% around age 21, there must have been 6 alive, and 1 death (thus survival probability was 5 ÷ 6 = 0.83) among those who were over age 15 and reached approximately age 20 during the study. This means that no more than 5 subjects could have been alive under age 1 during the 1986-1996 study period, and there may have been fewer than 5. It follows that the survival probability for the curve for those “living of age < 1 year” when the first death occurred (between age 4 and 5) should have been no greater than 80% (i.e., 4 ÷ 5), and it could have been lower than that.
It may have seemed reasonable to the authors at the time they did these analyses to include all subjects in the “living of age < 1 year” analysis given the obvious fact that anyone alive at, say, age 16 must have been living of age < 1 year at some time in the past. Thus, why not include those older persons in counting the denominator for the calculation of survival probabilities for those living of age < 1 year? The answer is that there would be an unknown number who died before reaching age 15 who ought to be included in determining the numerator (and denominator) for the calculation. Including those individuals who were older than 15 years during the 10-year study period among those who were under a year of age during the same period guarantees the survival of the latter group for a number of years (as many as 15 years or more), thus introducing the so-called immortal time bias.2
At this point, if anyone is not entirely convinced that including the subjects at older ages in the calculation of survival probabilities for those under a year of age at the beginning of the study is wrong, a hypothetical illustration might help. Suppose we wish to determine the probability of survival for a group of two-year-old children with neurological disabilities of a given level of functional ability, like group 4 in Plioplys et al. Further suppose that we are able to identify 50 two-year-old children meeting the criteria for inclusion in the analysis. Finally, suppose we follow those children for 1 year, and at the end of that year, with no loss to follow-up, we have found that 40 children remain alive, and 10 have died. Suppose for simplicity that all 10 died at the end of that first year.
Given this information, the proper analyses of survival and mortality probabilities are the following:
The probability of mortality from age 2 to age 3 is q = 10/50 = 0.20. (Equation 1)
The corresponding probability of survival is p = 1 - q = 0.80. (Equation 2)
In other words, this hypothetical information results in a 1-year probability of death of 20%, and a corresponding 1-year probability of survival of 80%. Given the information available, this is the correct survival probability at 1 year of follow-up.
Suppose, however, that at the start of this same study, when we first gather the information on the 2-year-olds described above, we also happen to identify an equal number (50) of 10-year-olds who, other than age, meet the criteria for inclusion in the study. These 10-year-olds were alive at 2-years of age at one time as well, and they survived to age 10, so they certainly survived from age 2 to age 3! We might (erroneously) conclude that we can include these 50 persons in the calculations of probabilities of death and survival from age 2 to age 3. Thus we might conclude (erroneously) that:
The probability of death at 1 year (i.e., to age 3) is q = 10/100 = 0.10; (Equation 3)
And:
The corresponding probability of survival is p = 1 - q = 0.90. (Equation 4)
This, again, is an example of the immortal time bias - those 10-year olds had no chance of dying between age 2 and 3 during the study period, since they had already reached age 10 when we began the study. Equations 3 and 4 provide clearly biased estimates of the survival probabilities from age 2 to 3 years for this hypothetical group of children.
Plioplys et al. apparently employed various versions of the immortal time bias in their 1998 study. If this were not the case, then it would be entirely unclear how they managed to get data from 1986 to 1996, a period of 11 years at most, to span 34 years in their survival curves.
Summary
We have examined three studies1,3,4 with erroneous calculations of mortality rates and survival probabilities. The errors in these studies are not without consequences. For a number of years, the results in the earliest study by Eyman et al.3 were cited by expert witnesses testifying in litigation about the life expectancy of neurologically impaired plaintiffs. That the life expectancies reported in Eyman et al. 1990 were erroneously low meant that corresponding opinions on life expectancy and expected present values of lifetime care costs for children were too low. Of late, we have not seen this study cited by anyone in support of an opinion on life expectancy in litigation. The error in Eyman et al. is now widely known, and experts generally steer clear of the study’s reported life expectancies. The same cannot be said of the 1998 study by Plioplys et al. Plioplys et al. 19981 has been cited in expert witness reports as recently as June of this year in support of the notions that: (a) very good care (compared to what?) can make life expectancy nearly normal in even the most devastating cases of cerebral palsy; and (b) all other studies of survival of neurologically injured children or adults cannot be relied upon as evidence regarding their life expectancy. No acknowledgement of the errors in Plioplys et al. was made by the experts using the study in this way.
In their 1998 textbook Modern Epidemiology, Editors Kenneth Rothman and Sander Greenland observed:
”Today, notwithstanding the important contributions to the field by many who consider themselves first as statisticians or physicians, epidemiologists have achieved a separate identity. Being either a physician or a statistician, or even both simultaneously, is neither a necessary nor sufficient qualification for being an epidemiologist. What is necessary is an understanding of the principles of epidemiological research and the experience to apply them.”5
Even the best epidemiologist will make a mistake now and then. Working with other qualified epidemiologists or medical researchers and having work reviewed through a suitable peer-review process will prevent many mistakes from finding their way into print. No process will ever be perfect, however, and the post-publication review process that naturally takes place is also important. Letters to the editor can serve to identify the most egregious errors. Such letters have pointed out the errors in Eyman 1993,6 and Plioplys 1998.7 The errors in Eyman’s 1990 study had been pointed out to Eyman (prior to his death), and have been explained to his co-author, neurologist Dr Herbert Grossman. Today, Dr Grossman understands the error and will acknowledge it. Dr Plioplys, in contrast, though his erroneous calculations have been drawn to his attention multiple times in many venues, remains in denial. He has in fact doubled-down, so to speak, on the erroneous calculations. In 2003 he published a review article in which he expands on his criticisms of other studies, including more recent studies that have utilized the California data originally analyzed by Eyman et al.8 In this 2003 review article, Dr Plioplys attempts again to explain why the results in his 1998 study demonstrated better survival than that observed in other studies. Plioplys’ 2003 review is rife with new errors, misconceptions, and misleading statements or hypotheses. We will lay out some of the more egregious errors in his thinking in future posts. In the meantime, We believe it’s fair to say that Dr Audrius Plioplys is not an epidemiologist; he would do well to lose a little sleep worrying about denominators before publishing anything further on these issues.
References:
- Plioplys AV, Kasnicka I, Lewis S, Moller D. Survival rates among children with severe neurologic disabilities. South Med J. 1998 Feb;91(2):161-72.
- Shariff SZ, Cuerden MS, Jain AK, Garg AX. The secret of immortal time bias in epidemiologic studies. J Am Soc Nephrol. 2008 May;19(5):841-3.
- Eyman RK, Grossman HJ, Chaney RH, Call TL. The life expectancy of profoundly handicapped people with mental retardation. N Engl J Med. 1990 Aug 30;323(9):584-9.
- Eyman RK, Olmstead CE, Grossman HJ, Call TL. Mortality and the acquisition of basic skills by children and adults with severe disabilities. Am J Dis Child. 1993 Feb;147(2):216-22.
- Rothman KJ, Greenland S. Modern Epidemiology. 1998 Philadelphia: Lippincott-Raven.
- Grossman HJ, Eyman RK. Survival estimates of severely disabled children. Pediatr Neurol. 1998 Sep;19(3):243-4.
- Strauss D, Shavelle R, Day S. Dr. Audrius Plioplys’ comparison of survival rates of children in the California data base and his own Chicago-area data base. Semin Pediatr Neurol. 2004 Sep;11(3):236.
- Plioplys AV. Survival rates of children with severe neurologic disabilities: a review. Semin Pediatr Neurol. 2003 Jun;10(2):120-9.